SCSI Toolbox :: Newsletter - August 2010
IN THIS EDITION
- Visually Comparing Drive Performance
- Ask Dr. SCSI - IO profiles explained
- 9.0 Beta Testers needed
- Customized training with an STB technician
![]()
Visually Comparing Drive Performance
Introduction
The STB Suites Disk Manufacturing Module (DMM) has the ability to drive I/O to and from disk drives at the disks full or fastest I/O rates. In addition it collects highly detailed performance metric information in an individual log file for each drive under test. These features allow detailed comparison and analysis of disk drive performance. Seeing the performance of a single drive is simple and as we’ll show in this article comparing the performance of multiple drives is just a matter of using a few common tools.
Log file text metrics
Here is an example of two log files created during one test session:
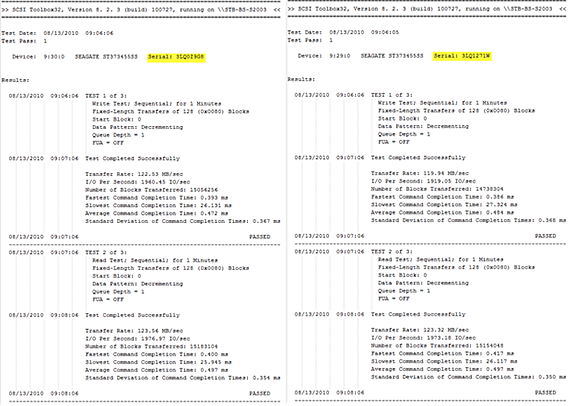
There is a lot of good information here, but even without the slightly blurry image you can see that it is difficult to understand the differences in performance between these drives. And of course adding more drives into the matrix just makes the comparison that much more difficult. What we need to do is extract just the information that we are currently interested in, and then use some visual tools to let us see the comparison of this data quickly and obviously.
Graphing the log file metrics
Graphing the pertinent performance information proves that old adage to be true, that a picture is worth a thousand words.
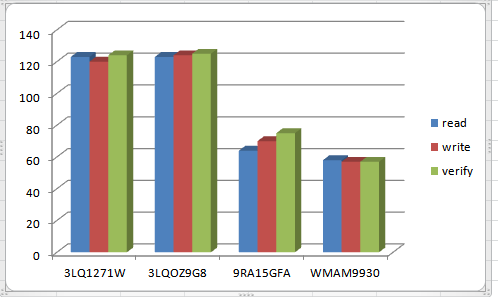
Here we see four drives comparing the Write, Read, and Verify transfer rates:
…and those same drives, this time looking at the IOPs achieved during each type of I/O:
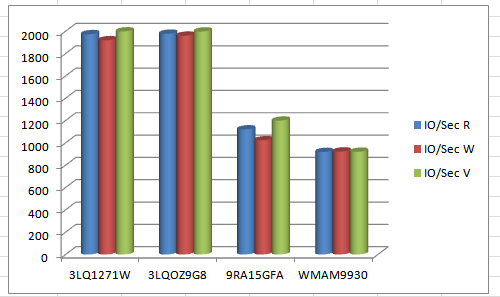
It is quick, easy, and accurate to see which drive offers the highest performance of the four.
Graphing data from DMM log files
The example graphs above were generated using the Microsoft Excel spreadsheet. The data used to generate both of these graphs is simply this:
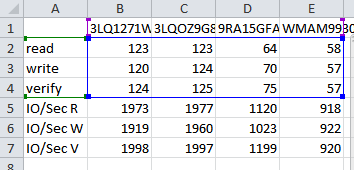
Once the data is input into the Excel graph it is simply a matter of selecting the group of data that you wish to graph – such as: 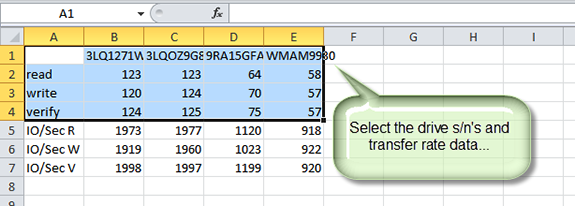
![]()
Ask Dr. SCSI - IO Profiles explained 
Q.“Can you explain what all the IO profiles in SCSI Toolbox accomplish, what exactly do they do?”
A. Streaming Test: Access is sequential, transfers are from 64-to-128 blocks, 20% of the I/O are writes, 80% of the I/O are reads
OLTP Test: Access is random, transfers are from 4-to-32 blocks, 20% of the I/O are writes, 80% of the I/O are reads
FileServer Test: Access is random, transfers are from 8-to-128 blocks, 20% of the I/O are writes, 80% of the I/O are reads
WebServer Test: Access is random, transfers are from 1-to-1024 blocks, 100% of the I/O are reads
Workstation Test: Access is a combination of sequential & random with 80% of the accesses are random and 20% are sequential, transfers are from 1-to-32 blocks, 20% of the I/O are writes, 80% of the I/O are reads
The Workstation Test is quite complex in terms of how it accesses a drive. 80% of the time when we generate the next LBA for an I/O that LBA is picked randomly. BUT 20% of the time the next LBA is sequential, which means if the previous I/O hit LBA X, then the next LBA is X + ”trans len” (so that the 2 I/Os are “next to each other” just as sequential does). For concreteness sake, let's say each I/O did a transfer of 10 blocks. Then the LBAs generated would be something like
781296, 1356, 1366, 1000225, 82, 987123, 101023, 101033, 15, 23567891
The above is 10 I/Os with the start LBA listed; note that exactly 2 I/Os have start LBA exactly 10 more than the previous (i.e. 1356 & 1366, and 101023 & 101033, all the other 8 I/Os are randomly generated)

You may have read from our July newsletter that STB is offering some really neat new server testing functionality. (See full release notes)
We're excited to roll out our 9.0 STB Suite release. However, we have delayed the 9.0 release to allow for more extensive testing.
If you're interested in becoming a beta tester for the 9.0 STB Suite release, please make sure you meet the following requirements then contact STB.
- Multiple licenses of the STB Suite (for Remote Manufacturing Engine - RME testing)
- Testing facility that has the computers networked to each other for RME testing (for Remote Manufacturing Engine - RME testing)
- Windows based OS required for 9.0 Beta.
(for Remote Manufacturing Engine - RME testing)
- Windows XP SP2 or later (32 and 64bit)
- Windows Server 2003 SP2 higher (32 and 64bit)
- Windows Server 2008 (32 and 64bit)
- Windows Vista (32 and 64bit)
- Windows 7 (32 and 64bit)
If you're interested in the beta, please use the contact form or call sales at 720.249.2641.
![]()
Customized training with an STB technician
![]()
Do you have questions about how to best use the STB Suite in your business? STB is happy to work with you in an interactive “live” environment to help you get the most out of your Toolbox. The cost? If you are a current Performa customer it is free! The commitment? Training sessions run between 30 and 60 minutes.
Here is a list of some recent customer training sessions that STB has conducted - live, interactive web sessions presented by STB programmers:
- SSD Manufacturing
- How to troubleshoot tape drive problems
- DOD disk purging
- Multi-drive SATA firmware downloading with the STB Suite
- Compliance testing
Contact Jeremy Wolfe at (720) 249-2641 today to schedule your own custom training session!